Case studies
Retrofits, with the receipts.
Completed commercial installations across Pakistan — pre- vs. post-installation monthly energy cost, bill reduction and payback.
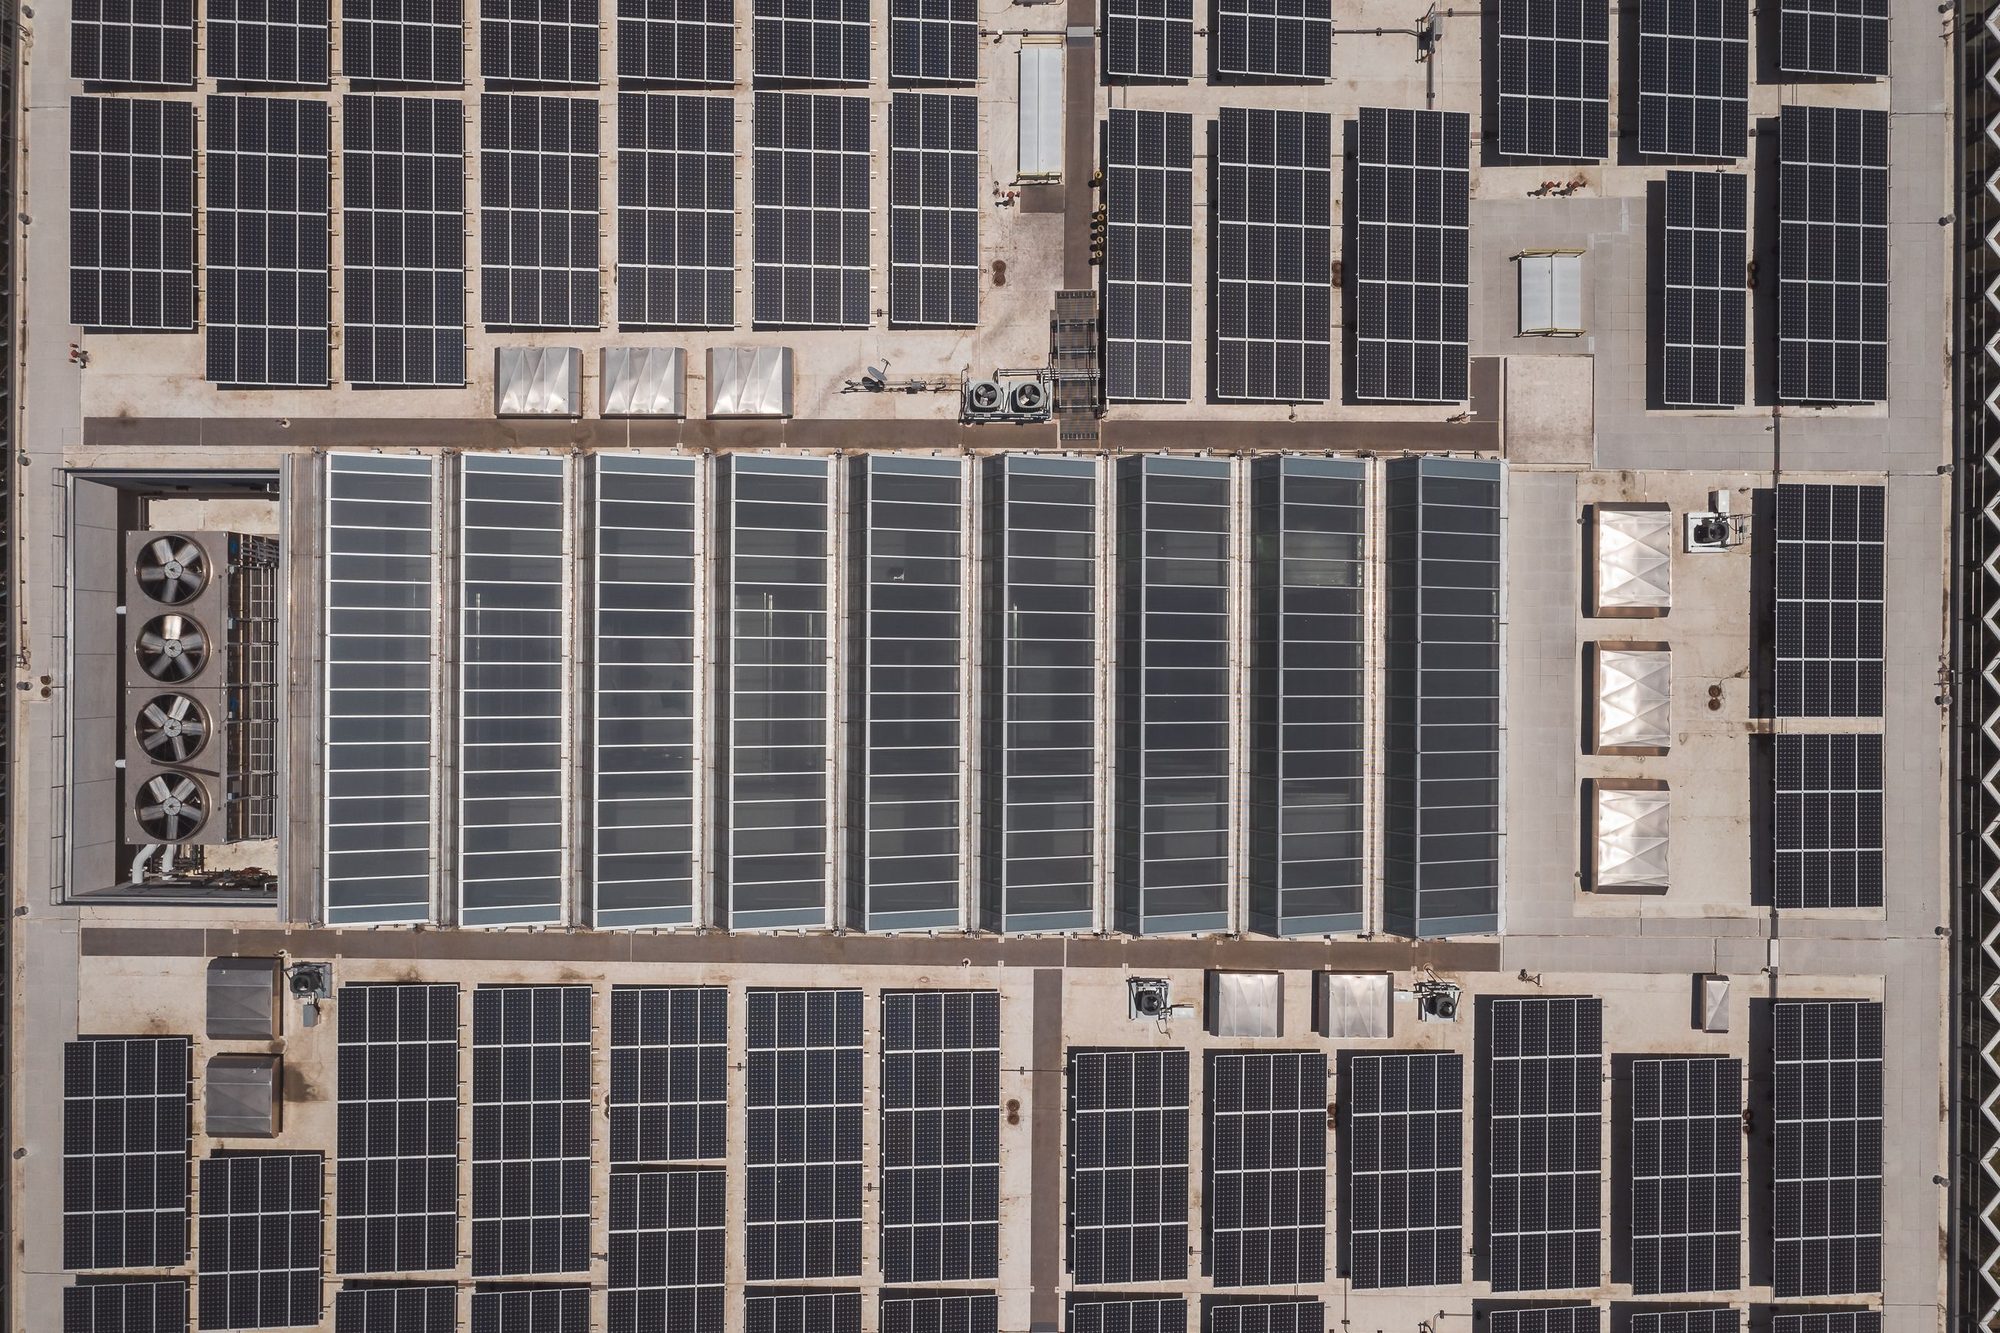
Completed deployment
Engineered layouts, measured results.
| Project | Location | Monthly · before | Monthly · after | Reduction | Payback |
|---|---|---|---|---|---|
| 100 kW · Textile Mill | Faisalabad | PKR 2.4M | PKR 0.7M | 71% | 4.6 yr |
| 250 kW · Cold Storage | Multan | PKR 5.1M | PKR 1.9M | 63% | 4.9 yr |
| 500 kW · Auto Parts | Lahore | PKR 9.8M | PKR 3.2M | 67% | 4.3 yr |
| 75 kW · Dairy Farm | Okara | PKR 1.6M | PKR 0.5M | 69% | 4.7 yr |
| 1 MW · Spinning Unit | Sheikhupura | PKR 18.9M | PKR 6.4M | 66% | 4.1 yr |
Figures are representative of completed S3 deployments. Corporate clients may also claim accelerated tax depreciation on solar assets under prevailing FBR rules — ask us for a depreciation-adjusted model.
Depreciation benefit
The payback is even faster after tax.
Commercial solar assets qualify for accelerated depreciation, improving effective payback for tax-paying entities. We model the after-tax case in every B2B proposal.
Want a model for your facility?
Send us 12 months of bills for an engineered, after-tax proposal.